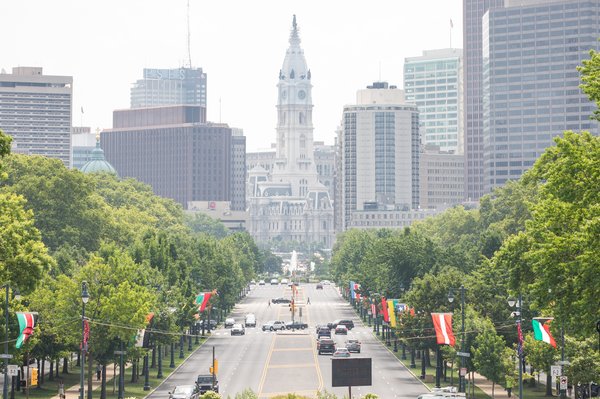
In an in-depth analysis of data mined from the U.S. census spanning from 2009 to 2014, urbanist site Next City ranked 55 Philadelphia neighborhoods according to which had seen the most (and which had seen the least) progress in that time.
The state of a neighborhood’s “progress” in the report is based on, essentially, how many neighborhoods had prospered from the myriad of growth and development the city has undergone over that five-year period.
- RELATED STORIES
- Bike ramp, two new murals slated for Ben Franklin Bridge
- Reports: Electric Factory sold to local developer for $20M
- Report: Some Philly renters expend more than half their income on 'low-end' apartments
The study determined scores for each neighborhood in regard to crime, household income, population, poverty and home prices, giving a detailed look at the data gathering process.
The neighborhoods’ scores were then weighed to find the city’s averages in each category as well. Crime scored a -19 percent, median household income a -7 percent, median house sales a +6 percent, population a +1 percent and poverty rate a +2.6 percent.
Unsurprisingly, areas of Center City are seeing the most prosperity, along with Point Breeze and other areas of South Philly.
Manayunk, West Mount Airy and Fairmount also fell in the study’s “Making the Greatest Advances” category. Roxborough, Olney and Nicetown were among the 10 neighborhoods falling in the second place “Advancing” category.
Sixteen neighborhoods stay in the “Average” category, where progress is neither significant nor omitting the area entirely. These neighborhoods are followed by the “Falling Behind” category, which includes East Falls, Fern Rock and Bustleton, among others.
Neighborhoods where progress is not only stagnant but that are also considered to be “Facing the Greatest Challenges” are Wynnefield, Hunting Park, Mantua, Holmesburg, Southwest Philadelphia, Frankford and Mayfair.
“Our goal was not to compare one neighborhood to another,” writes Tom Ferrick, the report’s author.
“Each has different issues it is grappling with – a different geography, a differing population mix and different density. That’s why, instead, we looked at how the city as a whole had performed during a five-year period in key categories and matched how close each neighborhood came to the house averages.”
Check out the full report here.

