August 23, 2019
 Thom Carroll/PhillyVoice
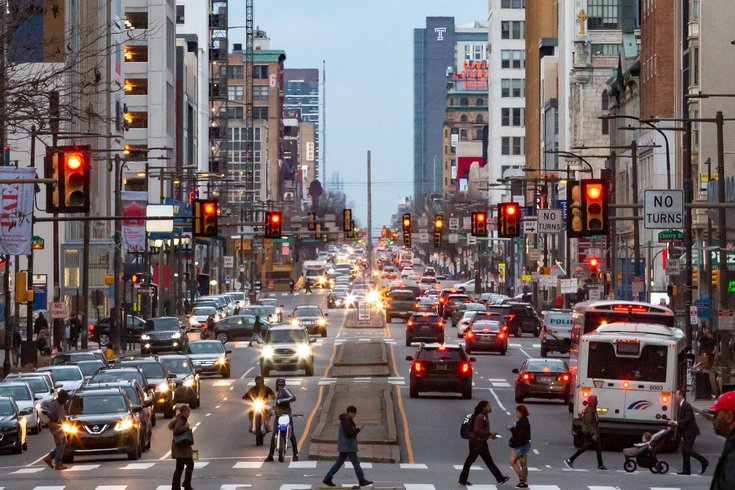
A new report on urban mobility suggest Philadelphia's commuters, like in cities all over, are spending more time in their car and losing more money because of congested traffic.
There are new startling numbers about just how much time Philadelphia's commuters lose to traffic on the city's increasingly-clogged streets and expressways.
This week Texas A&M's Transportation Institute released the 2019 edition of its Urban Mobility Report. It looks at data from all over the country, and commuters in the Greater Philadelphia Area – which extends to parts of New Jersey, from Burlington County up to Trenton, and also includes tiny portions of Delaware and Maryland – are having record-setting trouble getting where they're headed.
In 2017, the report says, the average Philly commuters spent roughly 62 hours sitting in congested traffic, an all-time high for Philadelphia and 18th-worst rate in the United States.
That does not include not how much time motorists spent driving to or from their destinations. That 62 hours is how much extra time people lost just because roadways were jammed up. The number is up more than 200% from 35 years ago, when Philly commuters spent 19 hours in congested traffic in 1982.
Nationwide in 2017, congestion caused Americans in urban areas to spend an extra 8.8 billion hours in traffic and purchase an extra 3.3 billion gallons of fuel, for a congestion cost of $166 billion, according to the report.
"The ‘2019 Urban Mobility Report’ highlights the reality of how motorists in the largest urban areas across the U.S. are experiencing the negative effects of congestion levels in their daily lives," Marc Williams, Deputy Executive Director of the Texas Department of Transportation, said.
The Transportation Institute released a tool with its 2019 report, which allows users to browse by city, and also see what urban areas are losing because of traffic.
Philly is unique, compared to its fellow, very large, urban area peers, in that the majority of its traffic (42.8%) during peak hours occurs on streets, rather than freeways (28.3%).
Far less surprising is the time when the city sees its highest volume of delays: 4 p.m. to 5 p.m. on Fridays. The 60-minute window totals 2.4% of the city's congestion-related traffic despite accounting for just .59% of the entire week.
Use the Urban Mobility Report's web tool below to explore the data further.
Follow Adam & PhillyVoice on Twitter: @adamwhermann | @thePhillyVoice
Like us on Facebook: PhillyVoice
Add Adam's RSS feed to your feed reader
Have a news tip? Let us know.