Each year for the last 42 years, United Van Lines has released its National Movers Study, which examines which states U.S. residents are leaving, and which ones they’re moving to.
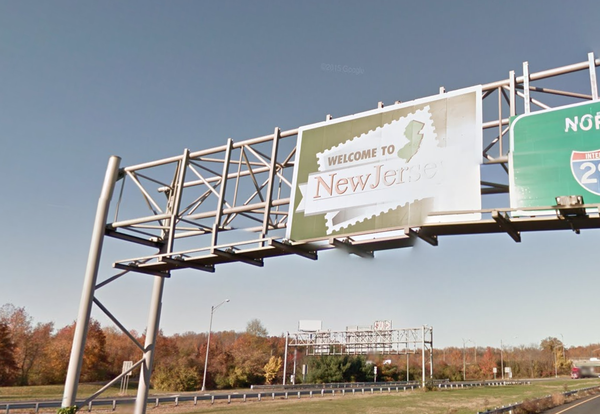
In 2018, New Jersey leapt past last year’s champion Illinois to take the top spot … on the wrong end of the spectrum.
According to the study, 66.8 percent of New Jersey’s moves last year were outbound, the highest rate in the country.
- MORE NEWS
- Temple alum's 'drunk' dad emails president, demands daughter become football coach
- Mummers skit condemned for blackface didn’t actually use blackface
- Megabus running special route between Philly, Chicago for Eagles-Bears Wild Card game
- Number of New Jersey towns banning plastic bags grows in 2019, more poised to join the crowd
Illinois (65.9 percent), Connecticut (62 percent), New York (61.5 percent), and Kansas (58.7 percent) round out the top five most moved-from states.
Among age demographics, New Jersey actually had a good year in terms of attracting its future: the 18-to-34 age group saw 7.97 percent more moves to the Garden State than moves away. On the other side, though, New Jersey saw retirees leaving the state nearly 10 percent more often than arriving.
You can explore the entire map below:

The main reasons for moving out of New Jersey, according to the study, were new jobs (34.73 percent), retirement (34.51 percent), and family (20.44 percent), followed closely by lifestyle (17.36 percent) and more distantly by health (6.15 percent).
Nearly two-thirds of people who moved to New Jersey in 2018 (61.84 percent) did it for a job.
The five most moved-to states last year? Vermont (72.6 percent), Oregon (63.8 percent), Idaho (62.4 percent), Nevada (61.8 percent), and Arizona (60.2 percent).
But hey, maybe those dog-friendly breweries will fix all of this.
Follow Adam & PhillyVoice on Twitter: @adamwhermann | @thePhillyVoice
Like us on Facebook: PhillyVoice
Add Adam's RSS feed to your feed reader
Have a news tip? Let us know.

