September 24, 2020
 Courtesy/Google
Google is launching a COVID-19 layer that allows users to easily identify locations with a high coronavirus case density.
Google Maps users will soon be able to track COVID-19 data as they travel place to place.
The navigation app is adding a COVID-19 layer that displays coronavirus data at the state, county and city level, when available. The label will be available on iOS and Android apps this week, Google announced in a blog post.
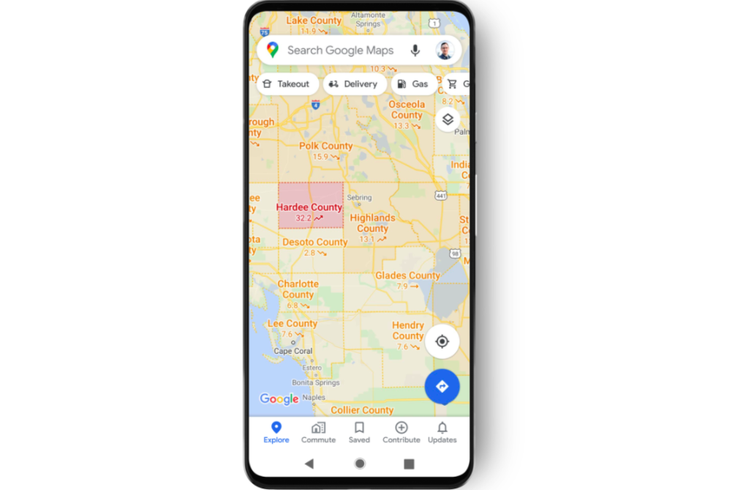
The layer will show the seven-day average of new COVID-19 cases per 100,000 people and a label indicating whether they are trending up or down. It also will use color coding to help users easily recognize areas with a high density of cases.
The data will be taken from John Hopkins' COVID-19 dashboard, The New York Times and Wikipedia.
"These sources get data from public health organizations like the World Health Organization, government health ministries, along with state and local health agencies and hospitals," Google Product Manager Sujoy Banerjee wrote in the blog post. "Many of these sources already power COVID case information in Search, and we’re now expanding this data to Google Maps."
The COVID-19 layer will be available in all 220 countries and territories where Google Maps is accessible. More localized data will be provided based on availability.
Here's how to access Google Maps' new COVID-19 layer.

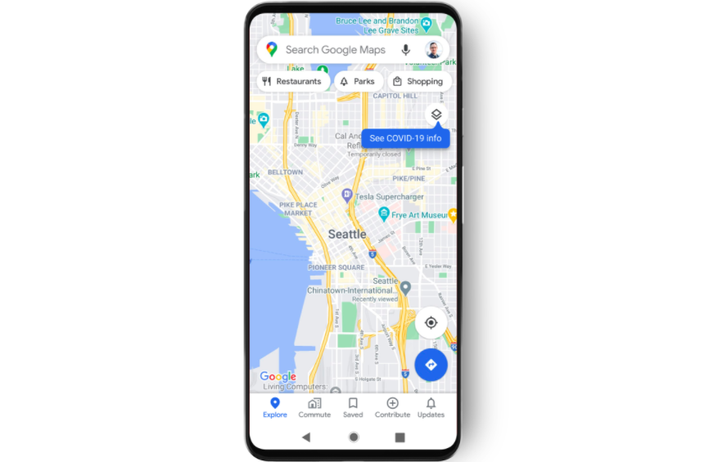
Click the layers button in the upper righthand corner, highlighted above with the message "See COVID-19 info."
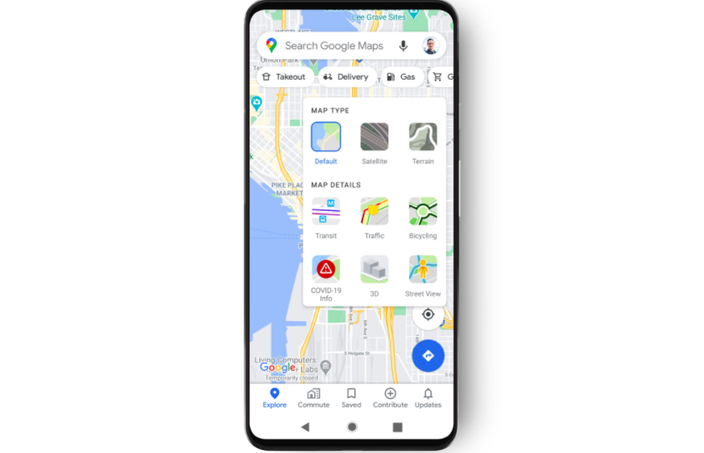
Click the COVID-19 info icon. The layer will be added to the map.
The new feature is being rolled out just days after the U.S. surpassed 200,000 confirmed COVID-19 deaths and as some public health officials worry of a coming fall spike in coronavirus cases.
Philly officials are emphasizing caution even though case numbers in the city are their lowest since March, noting coronavirus cases in other parts of the country are on the rise.
 Courtesy/Google