October 19, 2016
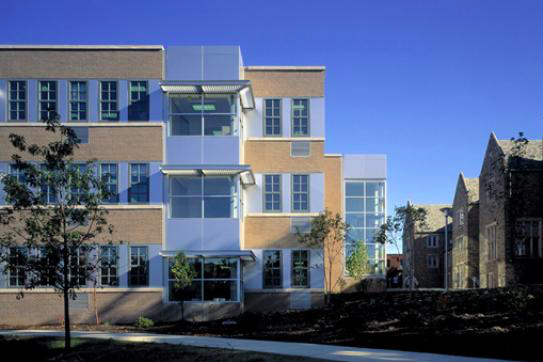
 Source/University of Pennsylvania
Penn Alexander School, formally known as Sadie Tanner Mossell Alexander School, is university-assisted school in West Philadelphia. It was formed in 2001 as a partnership between the University of Pennsylvania, the School District of Philadelphia and the Philadelphia Federation of Teachers.
The state Department of Education released 2016 School Performance Profile scores for all Pennsylvania schools last week, and using that information, PhillyVoice has ranked each of the public schools of the School District of Philadelphia, as well as the city's charter schools.
The first three tables below list the Top 10 district schools, separating them by middle, elementary and K-8 schools. The fourth table lists the Top 10 charter schools operating in Philadelphia. A list of the Top 50 high schools in Philadelphia and the suburbs, according to the state's SPP score, can be found here.
Release of the SPP scores had been delayed a year for most schools to give teachers and students extra time to adjust to the new Core Curriculum and realignment of the PSSA, or Pennsylvania System of School Assessment standardized test.
The 2016 SPP scores are the first to reflect middle and elementary school student performance on the more challenging PSSA. The Department of Education, at the direction of Gov. Tom Wolf, is currently working to make the standardized test-dependent SPP a "better, more holistic measure."
The SPP is calculated using numerous criteria, some weighted more heavily than others. These include student performance on standardized tests, like the PSSA, Keystone Exams and the SAT/ACT college admissions tests. The score also factors in how many students performed proficiently on standardized tests and improvements made by students who had previously underperformed on these tests, among other factors.
A more detailed description of the scoring criteria can be found here, and the searchable database of the reports for all the schools in Pennsylvania is available on the education department's website.
PhillyVoice also produced lists of the top suburban schools in Bucks, Chester, Delaware and Montgomery counties using the state's SPP scores.
• • •
(Out of 20 schools)
| Rank | School Name | SPP Score |
| 1 | C.C.A. Baldi Middle School | 81 |
| 2 | A.M.Y. Northwest | 75.6 |
| 3 | A.M.Y. at James Martin | 64.1 |
| 4 | Grover Washington Jr. School | 55.8 |
| 5 | Middle Years Alternative | 54.5 |
| 6 | Russell Conwell Middle School | 52.6 |
| 7 | Gen. J. Harry LaBrum Middle School |
48.1 |
| 8 | Woodrow Wilson Middle School | 46.5 |
| 9 | Austin Meehan Middle School | 45.2 |
| 10 | DeBurgos Bilingual Magnet Middle School |
42.8 |
| Rank | School Name | SPP Score |
| 1 | William H. Loesche School | 76.3 |
| 2 | Watson Comly School | 75.9 |
| 3 | John Hancock Demonstration School |
73.8 |
| 4 | A.S. Jenks School | 69.1 |
| 5 | Rhawnhurst School | 67.7 |
| 6 | Eleanor C. Emlen School | 66.4 |
| 7 | Anne Frank School | 65.2 |
| 8 | Olney Elementary School | 64.8 |
| 9 | Vare-Washington Elementary School |
63.4 |
| 10 | Joseph Brown School | 61.9 |
| Rank | School Name | SPP Score |
| 1 | Penn Alexander School | 88.1 |
| 2 | Albert M. Greenfield School | 83.7 |
| 3 | Joseph Greenberg School | 81.2 |
| 4 | William M. Meredith School | 79.6 |
| 5 | Eliza B. Kirkbride School | 77 |
| 6 | Gen. George A. McCall School | 73.9 |
| 7 | Stephen Decatur School | 70.3 |
| 8 | Mayfair School | 65.4 |
| 9 | Aloysius L. Fitzpatrick School | 64.4 |
| 10 | D. Newlin Fell School | 64.3 |
| Rank | School Name | SPP Score |
| 1 | Franklin Towne Charter High School | 94.6 |
| 2 | Mathematics, Science & Technology Community Charter School |
86.2 |
| 3 | Preparatory Charter School of Mathematics, Science, Tech, and Careers |
79.4 |
| 4 | Christopher Columbus Charter School | 77.9 |
| 5 | Folk Arts-Cultural Treasures Charter School |
77.3 |
| 6 | Franklin Towne Charter Elementary School |
76.4 |
| 7 | Independence Charter School | 73.5 |
| 8 | Alliance for Progress Charter School | 72.4 |
| 9 | Mastery Charter School – Thomas Campus | 72.4 |
| 10 | Eugenio Maria de Hostos Charter School | 71.9 |