August 14, 2016
 Thom Carroll/PhillyVoice
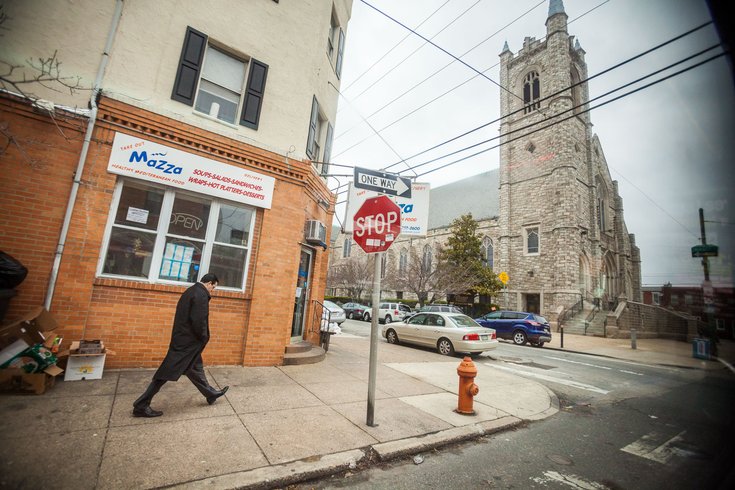
The 23 in South Philadelphia at 11th and Jackson Street.
Philadelphia residents and researchers interested in analyzing local public health data can now do so at the district level after the city released a new digital tool providing a breadth of information on current demographic trends.
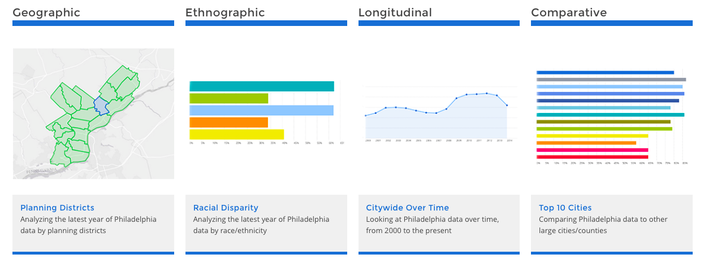
The web-based Community Health Explorer app, jointly developed by the Philadelphia Department of Public Health (PDPH) and the Office of Open Data and Digital Transformation, takes the city's public health survey a step further from other prominent annual studies that have examined national health data by county, grouping Philadelphia datasets into a single entity.
“This tool will allow anyone to see and better understand the health problems we face as a city," said Philadelphia Health Commissioner Dr. Thomas Farley. "We want to encourage everyone in Philadelphia to learn from it, and use that understanding to help us to address our most pressing health problems.”
With the release of Community Health Explorer, Philadelphia has for the first time opened up charts and maps covering a wide range of public health measures, including 77 indicators of health outcomes and the various factors that influence them.
Community Health Explorer.
At first glance, some of the information on Community Health Explorer paints a sobering picture of Philadelphia's public health status. In the Social Determinants of Health tab, moving south from the "North" district through "Lower North" and into "Central" shows just how stark community differences can be as you exit Center City — where population has gotten much denser, in its own right, since the turn of the century. Here's a sampling of data along this particular corridor:
| Philadelphia | North | Lower North | Central |
| Unemployment (16 and older) | 24 percent | 21.6 percent | 6.4 percent |
| Poverty | 46 percent | 46.9 percent | 15.1 percent |
| Life Expectancy (male and female) | 68.2 (m), 77 (f) | 67.4 (m), 74.6 (f) | 77.3 (m), 84.3 (f) |
| Premature Death (age-adjusted) | 12,200.90 | 14,422.10 | 5,761.20 |
| Adult Obesity Prevalence | 39.2 percent | 39.1 percent | 17.7 percent |
| New HIV Diagnoses per 100K | 54 | 95 | 53 |
| Teen births per 1,000 (15-19 years old) | 78.9 | 38.6 | 10.5 |
| Adults with diagnosed mental health condition | 29.1 percent | 25.4 percent | 16.6 percent |
| Child mortality rate per 100K (<18 years old) | 90.3 | 128.8 | 87.1 |
The greatest benefit of the app is that it covers a wide variety of health factors that tend to be scattered among other sources, making it much easier now to draw inferences and identify reference points for corresponding research. While it's not 2016 data — most of it comes from 2009-2014 — it's an excellent source to check against the latest statistics as they become available, either here or in other studies.
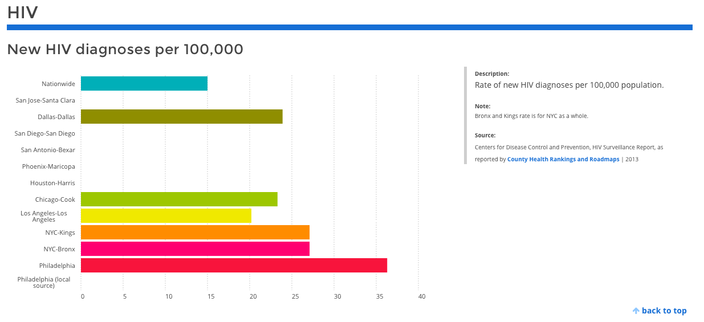
There are several positive trends to be spotted on the app: teen smoking prevalence is down, about 15 percent more students are graduating high school on time than in 2005, and new HIV diagnoses per 100,000 have fallen since 2006. That last point represents progress even as Philadelphia far surpasses the nationwide average for HIV diagnoses per 100,000, led by a recent increase in HIV diagnoses from male-to-male contact.
Top ten cities for new HIV diagnoses per 100,000.
This alarming rate explains, in part, why Philadelphia institutions were selected last month as key participants in a $23 million national research consortium to find a cure for AIDS. Similar links to public health initiatives and neighborhood programs abound based on the information presented in the new tool.
To assist researchers, the PDPH has made raw data contained in Community Health Explorer available for download. The city also encourages researchers, program planners, community members and others to use the data sets on OpenDataPhilly.org to promote activities that will improve public health in Philadelphia.
 Source/City of Philadelphia
  Source/City of Philadelphia