November 02, 2015
 Bill Kostroun/AP
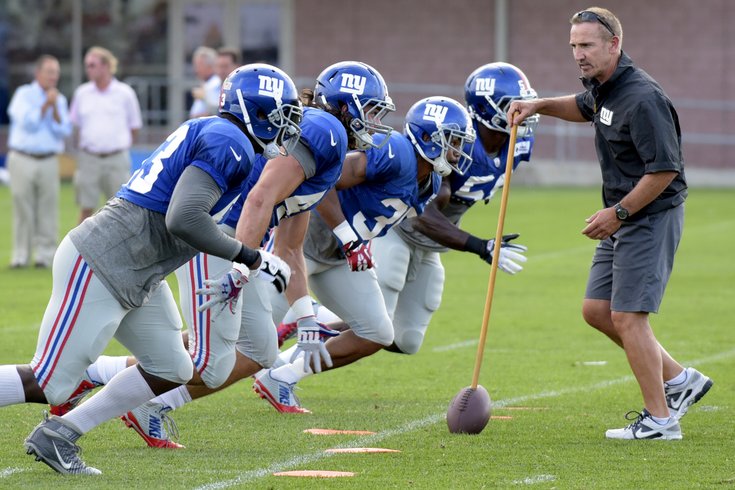
The Giants defense, shown dominating against a ball on a stick this preseason.
Yesterday in New Orleans, the New York Giants' feeble defense gave up 52 points and an absurd 614 yards of offense to the Saints. They are on pace to be one of the worst defenses in NFL history. Here are five facts about the 2015 Giants defense:
1) Over their last three games, the Giants have allowed 1,502 yards. Hang on... Let me get my calculator. Yes, that's bad.
2) On the season, the Giants are allowing 428.3 yards per game. They are on pace to allow 6,852 yards, which would be the second-worst total in NFL history. The worst was the 2012 Saints, who allowed 7,042 yards. Both defenses are/were led by Steve Spagnuolo.
| Year | Team | Yards allowed |
| 2012 | New Orleans Saints | 7042 |
| 2015 (proj) | New York Giants | 6892 |
| 1981 | Baltimore Colts | 6793 |
3) The Giants are dead last in the NFL with nine sacks, which puts them on pace for 18 on the season. Excluding strike-shortened seasons, that would tie them for the seventh-lowest sack total in a season since the NFL starting tracking sacks in 1982:
| Year | Team | Sack futility |
| 2008 | Kansas City Chiefs | 10 |
| 2009 | Jacksonville Jaguars | 14 |
| 1991 | Los Angeles Rams | 17 |
| 1995 | Jacksonville Jaguars | 17 |
| 2008 | Cincinnati Bengals | 17 |
| 2008 | Cleveland Browns | 17 |
| 2015 (proj) | New York Giants | 18 |
| 2003 | Chicago Bears | 18 |
4) The Giants have allowed 196 first downs on the season, or 24.5 per game. That is the worst in the NFL. They are on pace to allow 392 first downs on the season, which would be second worst in NFL history.
| Year | Team | First downs allowed |
| 1981 | Baltimore Colts | 406 |
| 2015 (proj) | New York Giants | 392 |
| 1981 | Seattle Seahawks | 371 |
| 1999 | Cleveland Browns | 368 |
5) Opposing offenses are converting third downs on the Giants at a 47.7% clip. That is second worst in the NFL, behind the Ravens. Since the NFL started tracking 3rd down conversion stats in 1991, that would be the eighth worst third down conversion stop percentage in the NFL:
| Year | Team | 3rd down conversions (defense) |
| 1995 | Cleveland Browns | 50.0 |
| 2010 | San Diego Chargers | 49.2 |
| 1991 | Indianapolis Colts | 49.2 |
| 1991 | Miami Dolphins | 49.0 |
| 1994 | Detroit Lions | 48.4 |
| 1996 | Baltimore Ravens | 48.2 |
| 2015 (proj) | Baltimore Ravens | 47.8 |
| 2015 (proj) | New York Giants | 47.7 |
And this is the team that is leading the NFC East.